5 Business Insights You Can Get from Pricefx Plasma
February 17th, 2023 (Updated 03/09/2023) | 10 min. read
By Milan Haba
Ever wondered how your business is comparing against your industry competitors on how quickly you close your deals? Or have you always wanted to see if your organization is discounting on more occasions to close deals than your industry colleagues do? If those types of pricing insights are the sort of thing that your company is looking for, it could be that we have just the tool to help you make those business insight dreams a reality.
In this article, we will discuss how Pricefx Plasma brings unprecedented pricing insights to enterprise companies just like yours, enabling you to measure your performance against pricing benchmarks, set up a competitive edge on other industry players in your sector, improve your internal pricing decision making, and optimizing your pricing strategy aligned with your overarching business requirements.
At Pricefx, since 2011 we have assisted companies across all ranges of industries to dramatically improve profitability and market share by defining optimal prices and pricing strategies utilizing a full pricing software suite of tools. Pricefx Plasma is an integral part of that technology suite, providing industry-level benchmarking to B2B enterprise companies that need to develop strategic insights into their pricing processes and performance to compare them to market averages.
Let’s get started with the article by diving into a brief description of what Pricefx Plasma is and what it does before we look at a small sample taste of 5 of the powerful pricing insights it can potentially supply to your business. We will finish with a bonus section on some real-world examples of how Pricefx Plasma works together with our holistic next-generation pricing software solution to deliver positive business outcomes to some of our customers.
What is Pricefx Plasma? – What Does it Do and How Does it Work?
Long story short, Pricefx Plasma is a big data pricing insights machine – combining a massive amount of anonymized transaction and quoting data from more than ten industries, sliced, and segmented by region, product type, and other factors. It is finally compiled into a set of 20+ pricing performance benchmarks, delivered in intuitive visual output that are designed to answer your company’s most important pricing analytics questions.
The system leverages a wide range of data (transaction and quote level data covering 10+ industries and 100+ companies).
Benchmarks are compiled from aggregated metrics for Industries with several anonymized entities, allowing you to analyze and filter data specific to your needs. This kind of industry-level benchmarking to other B2B enterprise companies in your field allows for strategic insights into your pricing processes and performance by comparing them to market averages.
Unique in the pricing world, Pricefx Plasma provides customers with the exclusive business advantage of being able to improve their pricing strategy and execution by eliminating anecdotical evidence, generic and poorly defined benchmarks, and pure guesswork when assessing their current pricing procedures
Data confidentiality and security are top priorities at Pricefx. The customer data used in the Pricefx Plasma system is anonymized by via double-blinding, making it impossible to trace any individual customer data. No one outside of Pricefx has the visibility or possibility to access the Plasma system’s unique customer identifiers.
The General Look & Feel of the 20+ Dashboards on Offer with Pricefx Plasma
You can choose from 4 different sets of charts:
- Executive Summary
- Plan
- Price
- Profit
You can select the business unit that you want to benchmark against other companies.
The industry will be yours by default.
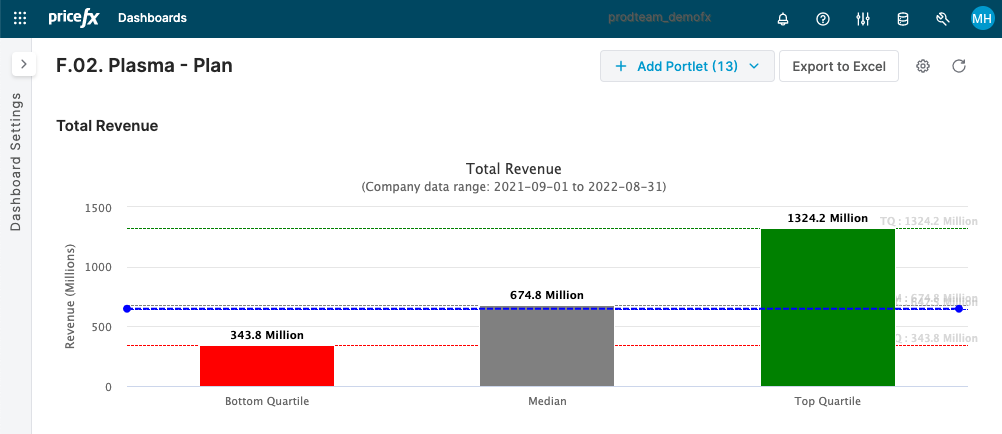
The image we are using above for our example represents the Total Revenue metric, accessed through the ‘Pricefx Plasma – Plan’ chart.
Most of the graphs on offer show you a benchmark for the bottom, median and top quartile of customers in your industry, comparing your performance with the average of other companies in your industry. This represents the extent of the range of typical performance against the entire company data set.
The blue line represents your company data and by clicking the company line metric you can expand the metric to show your company’s performance trends over time.
5 Business Insights that Pricefx Plasma Can Offer Your Company
Remember, there are more than 20 dashboards and metrics available with Plasma to use to power your company’s pricing insights. Check out these sample 5 business insights you can use to power your company’s pricing;
1. Total Revenue
A simple but effective metric, you can see how and where your company sits in terms of total revenue either against the total number of business units or where your company sits against other companies in your industry sector.
Looking at the sample image in the section above, for the period 1 September 2021 to 31 August 2022 you can see that the total revenue of the bottom quartile of other business units was $343..8 million, and the median total of all business units was $674.8 million.
Using the above image as an example, you can see by viewing the blue line that your business sat approximately the average of all business units using the tool
In other words, your business has work to do to stand out from your competitors.
Why is Total Revenue Benchmarking Important?
How much money your business is bringing in is the starting point for determining its success. Total revenue reveals how much money is generated before any expenses or deductions. As a result, this metric lets you know how much the business is making from selling its products or services.
The total revenue formula helps business owners to decide whether they should raise their prices or offer a discount on their goods.
If like the company in the example above, you already know that you are close to being a top revenue raiser, you might want to consider increasing your prices and leveraging a value-based pricing strategy, rather than simply choosing to use a competitive pricing strategy.
2. Deal Velocity
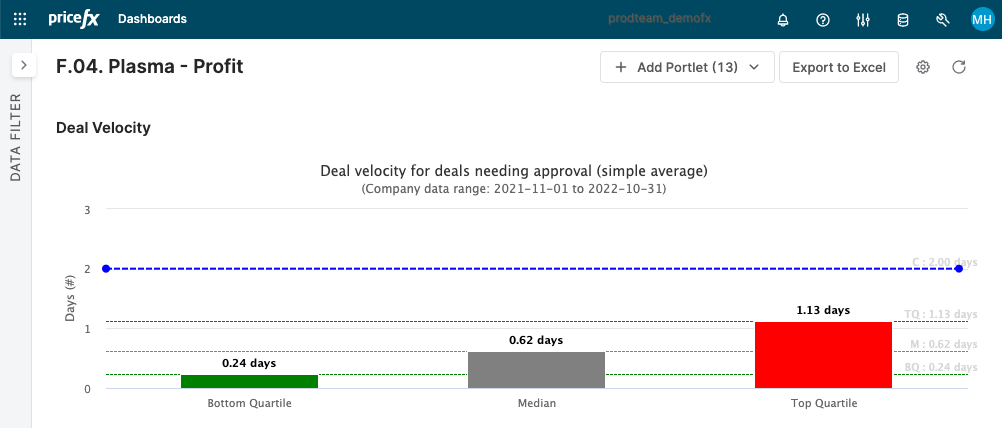
One of the most insightful metrics that you have at your fingertips with Pricefx Plasma is Deal Velocity.
For example, looking at the above image, this company takes 2 days to quote a deal while the median quartile is less than day, indicating an area for potential opportunity.
It could be that this business is yet to, (or is still in the process of implementing) the fully automated Pricefx CPQ (Configure Price Quote) price quoting tool to cut down their quotation times.
As a powerful, user-friendly sales tool, CPQ shortens the quoting process while reducing the time spent by your sales team on performing administrative tasks. Remembering previous quotes for similar customers, offering optimum prices with automated workflow approvals, and suggesting product combinations for upsell and cross-sell opportunities (and much more), CPQ software provides business organizations with the opportunity to improve their quote response times, increase sales win rates, and drive overall revenue growth.
3. Deals Outside Discount Guidelines
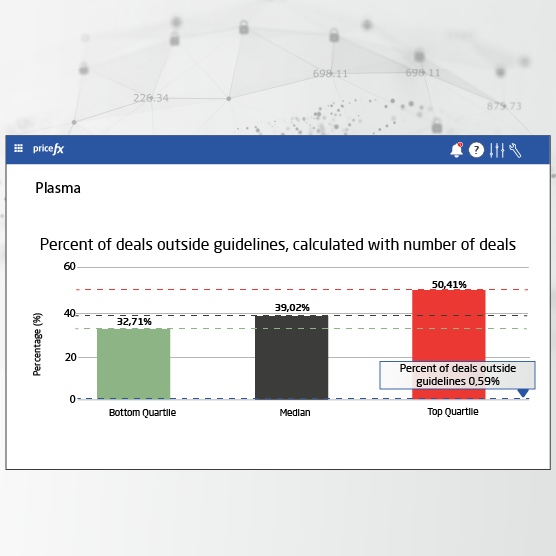
Another way that you can use Pricefx Plasma to aggregate your data into an intuitive and impactful visual business tool is using the system to identify the percentage of deals that your company is undertaking outside of your company’s discount guidelines.
Looking at the image above, this company is having enormous success with its salespeople following the pricing guidance from their pricing software and remaining within the suggested pricing corridor.
This company has very few deals outside of its discount guidelines (in fact, only 0.59% of all total deals are outside their discount guidelines), as they are well below the median quartile benchmark.
That means that their sales team are not using discounting as a way of securing their deals and it is more than likely that the organization is leaning into the use of a value-based pricing strategy. Chances are that this Sales Team has begun connecting and collaborating with other parts of the organization, like the Purchasing Department to enable even more proactive pricing around cost changes, or even the Finance Department, to home in on strategic goals.

4. Percentage of Products Required to Reach Revenue
Another great business insight that Pricefx Plasma allows for your business is to gain visibility into what percentage of products are contributing to your organization’s revenue number.
Looking at the above snapshot image from Pricefx Plasma, it shows the example of company with a strong diversity of products (52.41% of its products contribute 80% of revenue versus the industry wide standard of 15.47% of products contributing to 80% of revenue).
What do these insights indicate?
The company in the above example is getting robust performance with more than half of their product line. Compared to their industry colleagues, the company above is maximizing its cross-product portfolio performance, while its competitors are putting a lot of wasted time, money, and efforts into 84.53% of their products.
It is a great sign for the company above that they are spreading their revenue-raising efforts widely across their product line, while still indicating room for business improvement and further efficiencies.
5. Percentage of Accounts with Negative Margins
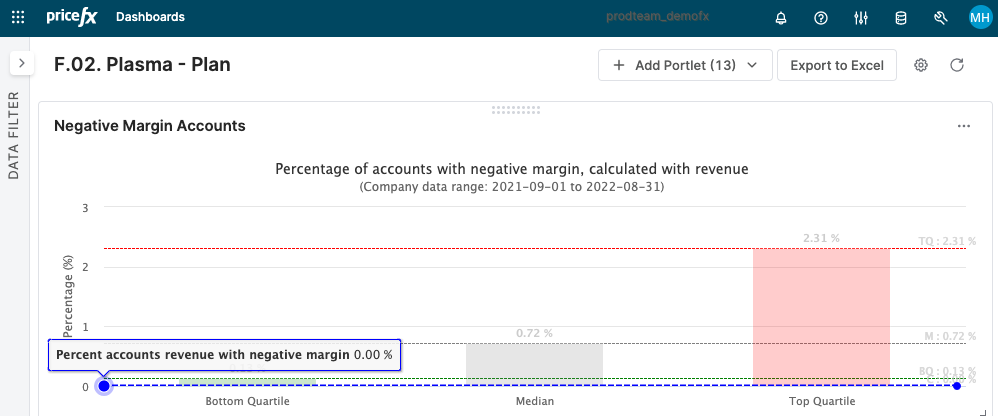
It’s always nice to know that your company is not losing money on any of your deals. As you can see above, the company in this example has 0% of its accounts with a negative margin.
Naturally, that is great news, but the interesting thing is to see is that some of this company’s competitors do have some accounts with negative margins (i.e., organizations in the median quartile have 0.72% of their accounts with negative margins, while companies in the top quartile have 2.31% of their accounts with negative margins).
This kind of business insight produces good and bad news of sorts, or at least points to an ominous warning. While it is great for the business from the above example to know that none of their accounts have negative margins, it comes with a dose of caution to learn that some companies can also slip into the negative.
To ensure it does not slip into the negative margin deals like its competitors, the company in the example above will be ensuring to watch its discounts and promotions wisely and advise their salespeople to stick within their data-informed ‘sales corridors’ and not dive too readily into discounting to secure more sales volume.
Setting sales incentives based on value rather than total numbers of sales can assist in ensuring that negative margin accounts can be avoided.
Using Pricefx Plasma in Combination with a Total Pricing Software Solution
Now you know just 5 of the many business insights available by using Pricefx Plasma to help power your company’s pricing.
But once you start to combine the insights available from Plasma with the total award-winning Pricefx pricing solution, the data begins to become even more illuminating and valuable.
For example, looking at just a few examples from the 2023 Pricefx M1 Metrics Database report, one Food & Beverage company reported year-on-year increases (from their pricing software go-live date) to both their Revenue (13.7%) and Margin (18.7%) numbers. Meanwhile, a discrete manufacturing company saw a 37.4% increase on their revenue figures just 12 months after their Pricefx go-live.
If you would like to learn more about which part of the Pricefx pricing solution could help your business drive those sort of key metric increases, check out this handy article:
 On the other hand, if you have already done your research and know where you want to start your journey with Pricefx and Plasma, just in touch with us today:

Happy Pricing!