What Does Value From Pricefx Look Like?
February 12th, 2024 (Updated 02/17/2024) | 6 min. read
When considering Pricefx software, you might ask, how do its key benefits – better pricing, execution, and discipline – translate into tangible value for my company? And rightfully so – if you’re considering our solutions, you’ll need to see the right returns to be confident in the investment. To help inform your choice, in this article, you’ll discover exactly what value from Pricefx looks like, both in terms of how it’s projected and later measured.
Here at Pricefx, as a leading enterprise-grade pricing software solution, we take pride in offering a comprehensive selection of tools for measuring value to enable companies like yours to make informed decisions with data-driven insights.
After reading this article, you’ll discover how Pricefx defines financial value and the methodology for predicting and measuring it, including the tools used and roles involved.
How Does Pricefx Define Value?
The value offered by pricing software is typically understood as positive impact on two areas: profitability (financial) and scalability (operational). In this article, we’ll address the financial value of our software – how it’s projected and how it’s later measured.
What’s the role of our pricing software solutions in improving financial metrics like revenue turnover or margins? Pricefx achieves this by offering pricing governance, or consistent management of pricing and outliers, and optimization, fine-tuning prices with the help of pricing science and AI. By having a vehicle to maintain consistent pricing strategies, control exceptions, and offer competitive pricing in their industry, businesses can reduce costly waste – both in inefficient processes and unaccounted margin leakage – and ultimately, support their bottom line.
Let’s now take a closer look at our methodology for predicting and measuring value for companies planning to use Pricefx.
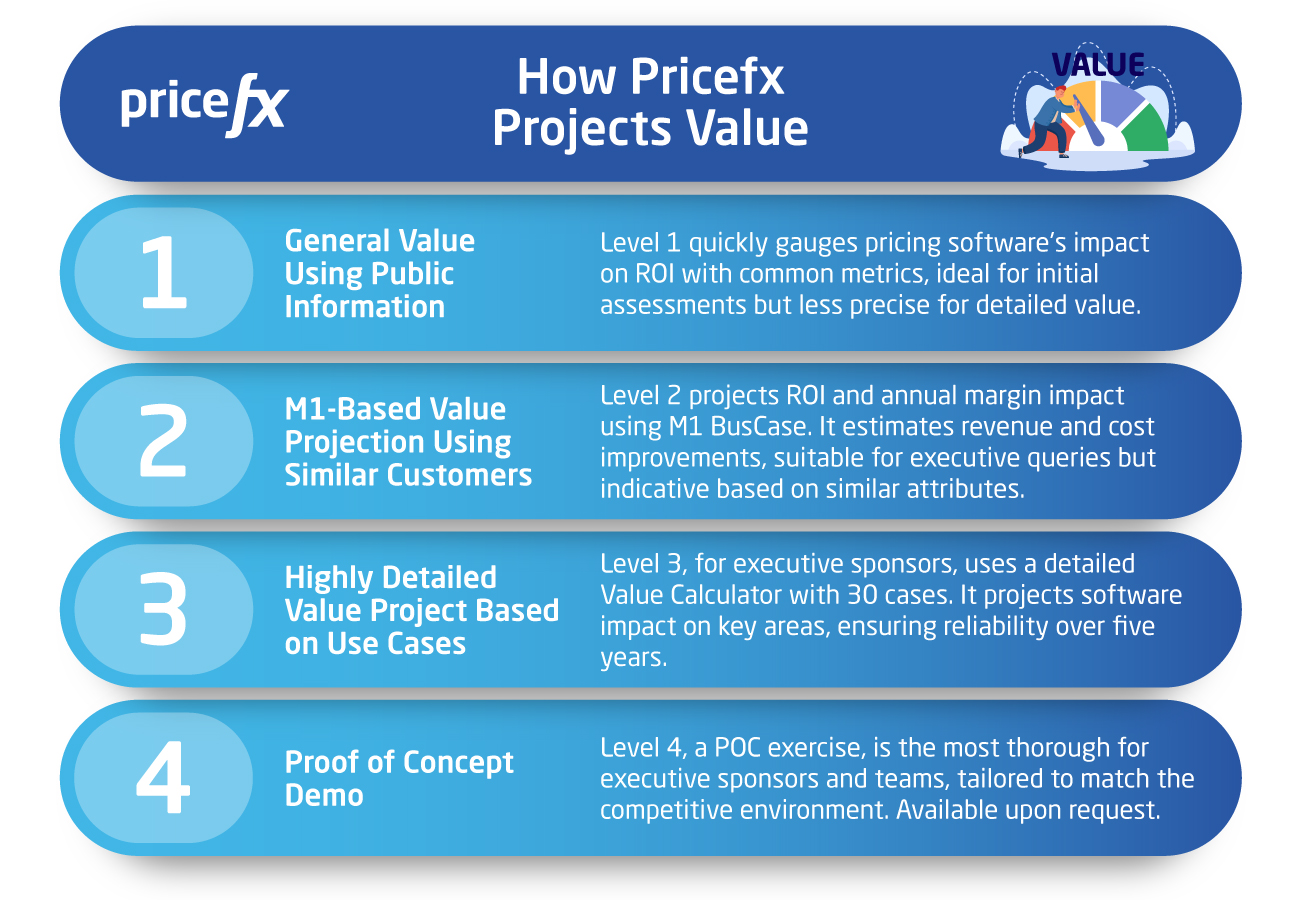
How Pricefx Projects Value for Your Company – All Levels Explained
At Pricefx, we have four levels of measuring the value enterprise-level companies can expect from using our pricing software solutions. Account Executives, Solution Strategists, and Solution Sales are responsible for projecting value early on, followed by Customer Success, who makes sure via analytics tools that this anticipated value is delivered.
Your company should have a clear idea of which level to request from Pricefx by considering the degree of detail you can provide us on your unique problems (and the capabilities to address them), as well as the depth of value analysis needed.
For instance, if you’d simply like to make a quick general query and weigh options, opting for the first level makes sense. Conversely, if your company has a clear idea of what it needs and has executive sponsorship involved, higher levels will provide the granular value analysis required for decision-making.
Here’s a detailed breakdown of what each value level involves and who it’s for.

1. General Value Using Public Information
This first approach provides a general indication of the likely impact, such as revenue and margin improvements, of pricing software on ROI by using common public studies and metrics from the likes of Gartner and McKinsey.
In essence, level 1 answers the question, is pricing software right for my business? It’s ideal in the beginning of your vendor search for gauging value quickly without having to offer much on what you’re looking for in a solution or hoping to solve. Conversely, this isn’t an ideal option if you’d like a more granular or precise indication of value.
2. M1-Based Value Projection Using Similar Customers
The second approach involves projecting ROI and annual impact on margins by comparing your company’s attributes (size and industry) with those of similar customers.
Here, value is based on metrics like gross margin percentage and revenue and is calculated using our M1 BusCase tool.
The M1 BusCase tool takes your existing revenue, margins, and diverse operational costs and estimates how these figures will improve after using Pricefx. We calculate this projection based on your Revenue under Management (RUM) and gross margin and profit percentages. Here, you can view the net benefits of using Pricefx over a multi-year span for straightforward long-term profit and return forecasting.
At this stage, the Margin Lift (or Impact) Calculator is also available, which provides an estimation of margin improvement across capabilities on a business unit basis.
The level 2 approach to measuring value is ideal for general queries from executive sponsors. Keep in mind that at this stage, you’ll need to have some idea of your requirements and pain points. Additionally, as we calculate projected value by leveraging the data of customers using similar attributes and capabilities, this projection, while more targeted than that of level 1, should still be treated as indicative.
3. Highly Detailed Value Project Based on Use Cases
Level 3 is appropriate for companies at the executive sponsor stage looking to develop a business case for our software. Value here is at its most detailed, projected based on use cases (as opposed to more general metrics), and is the most reliable.
This level involves an in-depth analysis of potential value using a pre-sales Value Calculator, covering nearly 30 value cases, that estimates the current and future state of your company’s processes and projects impact over an approximately five-year period.
The Value Calculator projects the impact of the software tool on key areas, including improvements in gross margin (such as margin retained due to faster price charge execution) and revenue (including additional revenue from improved and quicker execution.
4. Proof of Concept Demo
This last level is a Proof-of-Concept (POC) exercise, the most in-depth option for executive sponsors and teams designed to match the complexity of the competitive environment. Note that this option is available upon request.
How Do We Measure Delivered Value After Implementation?
To measure delivered financial value, we use a few tools – namely PoP (period-over-period) charts and Breakdown dashboards, which analyze trends in historical performance to pinpoint what has improved.
While PoP charts are time or result-based indicators of the magnitude of change in a company’s performance, Breakdown dashboards outline how revenue and margin have changed through factors like price, volume, portfolio diversification, and cost. In other words, PoP charts quantify how a business improved over the year and Breakdown comes in to explain where those improvements came from.
Additionally, our benchmarking tool, PricefxPlasma, allows a company to understand how it ranks in performance and pricing process efficiency compared to similar companies in our customer base:
Need a Reliable Value Projection for Your Company? Try Our Margin Lift Calculator
At this point, we hope your company has a clearer grasp of how we approach value at Pricefx—both in projecting and measuring it later. Implementing pricing software is a significant investment, and understanding the expected returns upfront should empower you with the confidence to proceed.
In our article, we called out the margin lift calculator as one option for estimating projected value in a few simple steps. Interested in trying it out for yourself? Feel free to visit our Margin Lift page:

